Classical Machine Learning
Understanding the roots of modern AI.
Learning from Data
We are often trying to predict some outcome from a set of observations . For example, meteorologists try to predict tomorrow’s rainfall () from today’s temperature, humidity, pressure, and windspeed (). Bankers try to predict the likelihood of fraud () given a time, location, merchant, and transaction amount (). The purpose of statistics is to create a simplified model of the relationship between and , and to apply this model to uncover patterns in real-world data. These patterns can then be used to guide future decision-making, like whether you need to bring an umbrella tomorrow.
Statistical models often go through two distinct stages: training and deployment. During training, a model is applied to a dataset to summarize the relationship between and . During deployment, new observations are fed to the model to generate predicted outcomes. Tying back to our previous example, you might train a rainfall prediction model on a large dataset of historical weather measurements. You would then deploy your model to predict tomorrow’s rainfall.
Statisticians often make the assumption that , where is a function that determines the relationship between and . In the real world, we do not know what looks like. It’s exactly what we’re trying to investigate! This assumption is important, though, because it tells us that contains enough information to compute a good guess for .
Exercise: List a few ways that this assumption might be violated.
Linear Regression
In general, it is very difficult to find the true function from a finite dataset, so statisticians often make further assumptions. One of the simplest assumptions is to say that is linear. This problem setting gives rise to linear regression.
In particular, linear regression assumes that we have: . When we have multiple observations (e.g, temperature, humidity, pressure, and, windspeed), then and are technically vectors. What this means is:
where corresponds to the first observation (temperature), corresponds to the second (humidity), and so on. The parameters and are unknown, but they completely determine . Thus, the goal of linear regression is to estimate the values of and from our data.
In the real world, the linearity assumption almost never holds; the relationship between our observations and the outcome is usually much more complex. Even still, linear regression remains the most widely used model in the world for a few reasons, which we’ll discuss below.
First, one benefit of the linearity assumption is ease of interpretation. If corresponds to today’s temperature in Celsius and corresponds to inches of rainfall tomorrow, then tells us how many more inches of rainfall we should expect if today’s temperature increased by one degree Celsius. (When the value of is negative, we interpret it as how much less rainfall to expect.) The value of the intercept simply tells us the predicted value when all observations equal zero.
Second, linear regression models are extremely fast to train. The training procedure for linear regression only involves a few steps of linear algebra. Our hardware has been optimized to perform these kinds of operations, and so linear regression is very easy to apply, even to very large datasets.
Finally, and perhaps most importantly for the statistician, linear regression allows us to describe uncertainty about our findings. Often, we want to test if our observations are truly associated with the outcome. For example, when scientists invent a new cancer therapy, we want to see if it actually works. To investigate this question, we might run a linear regression where represents the drug dosage for a patient, and represents the size of the patient’s tumor after six months. If the cancer drug is effective, then we should see a negative relationship () between drug dosage and tumor size: the more drug we apply, the less cancer we should see (up to a reasonable threshold). However, real-world data is always noisy. Even when there is truly no relationship between drug dosage and tumor size, we might still run our model and get a small negative estimate of . Luckily, linear regression allows us to calculate the probability of seeing a result like the one we get from our data, supposing that the drug truly has no effect (). This is known as a -value, and it serves as the backbone of statistical hypothesis testing.
Modern AI techniques are more concerned with prediction than hypothesis testing, and so this will be the last mention of -values, but they are an important advantage of linear regression and other classical statistical techniques!
Lastly, before moving on to neural networks, it may be useful to see an example of linear regression applied to real-world data. Here, we take a look at the historical relationship between the quarterly change in US GDP growth and the quarterly change in the US unemployment rate.
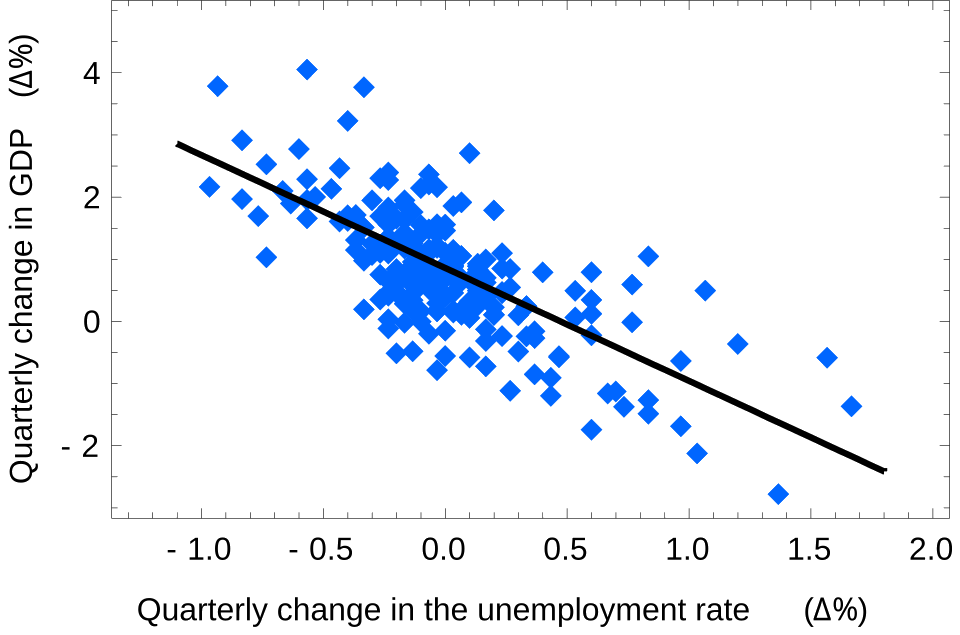
In the figure above, the real data is plotted in blue, and the prediction of our linear regression model is plotted in black. The model fits the data very well, especially considering that the US economy is a complex system. Hopefully, this example demonstrates how linear regression can be surprisingly effective, even with its simplifying assumptions. (The linear relationship above is known as Okun’s law to economists, in case you’re interested in learning more.)
Exercise: Is the value of positive or negative in the model above? Does the answer depend on which variable we consider to be and which we consider to be ?
Further Study
This video gives a slightly more formal introduction to linear regression if you’d like to see more of the details.